Www1.ece.neu.edu

Information Cut for Clustering using a Gradient Descent Approach Robert Jenssen∗ 1 , Deniz Erdogmus?, Kenneth E. Hild II†, Jose C. Principe‡ and Torbjørn Eltoft∗, ∗Department of Physics, University of Tromsø, N-9037 Tromsø, Norway ?Oregon Graduate Institute, OHSU, Portland OR. 97006, USA †Biomagnetic Imaging Lab, University of California, SF, CA. 94143, USA ‡Computational NeuroEngineering Laboratory, Department of Electrical and Computer Engineering, University of Florida, FL. 32611, USA We introduce a new graph cut for clustering which we call the Information Cut.
It is derived using Parzen windowing to estimate an information theoretic distancemeasure between probability density functions. We propose to optimize the Infor-mation Cut using a gradient descent-based approach. Our algorithm has severaladvantages compared to many other graph-based methods in terms of determiningan appropriate affinity measure, computational complexity, memory requirementsand coping with different data scales. We show that our method may produce clus-tering and image segmentation results comparable or better than the state-of-theart graph-based methods.
Key words: Graph theoretic cut, information theory, Parzen window densityestimation, clustering, gradient descent optimization, annealing.
In signal processing and data analysis, it is often desirable to partition, or cluster,a data set into subsets. Several textbooks provide surveys of traditional clusteringtechniques, see e.g. [1–3].
Recently, a new line of research in clustering has emerged. It is based on the notionof a graph cut. A set of points, xl, l = 1, . . , N , in an arbitrary data space can berepresented as a weighted undirected graph G. Each node in the graph corresponds Corresponding author. Tel. (+47) 776 46493, Fax. (+47) 776 45580, Email: Preprint submitted to Elsevier Science to a data point. The edge formed between a pair of nodes, say l and l0, is weightedaccording to the similarity between the corresponding data points. The edge-weightis denoted kll0. The graph cut provides a measure of the cost of partitioning a graphG into two subgraphs G1 and G2, and is defined as where the index i = 1, . . , N1, runs over the N1 nodes of subgraph G1 and the indexj = 1, . . , N2, runs over the N2 nodes of subgraph G2. That is, the cut measures theweight of the edges which have to be removed in order to create the two subgraphs.
Wu and Leahy [4] first proposed to minimize the cut-cost as a means for clusteringand image segmentation.
Shi and Malik [5] pointed out that the cut tends to produce a skewed data partition.
It will in fact be minimized if one node in the graph is isolated in one group, and allthe rest in the other group. They proposed the heuristically motivated NormalizedCut (NC), defined as where Assoc(G1, G) = PN1,N k il and Assoc(G2, G) = PN2,N jl, i.e. the total connec- tion from nodes in G1 (G2) to all nodes in the graph G. Shi and Malik optimized theNormalized Cut based on the eigenvectors of the Laplacian matrix L = D−K. Here,D is a diagonal matrix where the mth diagonal entry is given by dm = PN The matrix K = kll0, l = 1, . . , N, l0 = 1, . . , N, is called the affinity matrix.
Several other heuristically motivated cut normalizations have also been proposed,such as the min-max cut [6], the typical cut [7] and the BCut [8]. When the opti-mization is carried out based on the eigendecomposition (spectrum) of a matrix, themethods are referred to as graph spectral clustering methods. Graph spectral clus-tering methods have been promising compared to traditional clustering methods.
Other examples of spectral clustering methods can be found in [9–16].
The main problems associated with graph spectral clustering methods are the fol-lowing. An appropriate affinity measure (edge-weight) must be selected. Often, thiscorresponds to selecting the width of an exponential kernel function. There is nowidely accepted procedure to select this parameter, even though it heavily affectsthe clustering result. Furthermore, the (N × N) matrix K needs to be stored inmemory, and possibly other matrices too. In addition, a matrix eigendecompositionneeds to be done. The computational complexity of computing an eigenvector of a(N × N) matrix is in the order of O(N 2). Hence, finding all the eigenvectors scalesas O(N 3). Also, it is a concern that the various graph spectral cost functions arebased on heuristics, and lack a clear theoretical foundation.
In this paper, we introduce a new theoretically well-defined graph cut for clus- tering, named the Information Cut. The Information Cut is basically a Parzenwindow-based estimator for the information theoretic Cauchy-Schwarz divergencemeasure between probability density functions. We are faced with the task of as-sigining cluster memberships to the data points such that the Information Cut isminimized. We propose a gradient-based optimization strategy, as opposed to aneigenvector-based approach. There are several advantages to our approach. We areable to select an appropriate affinity measure (kernel size) based on data-drivenrules for optimal Parzen window density estimation. Furthermore, there is no needto store the affinity matrix in the computer memory. And also, using a stochasticsampling approach to gradient estimation, our resulting clustering algorithm has arelatively moderate computational complexity of O(M N ), M  N, at each itera-tion cyclus. Here, M is the number of stochastically selected samples to be used inthe computation. The main disadvantage of a gradient-based approach for optimiz-ing non-convex cost functions is the problem of convergence to a local minimum ofthe cost function landscape. We incorporate a strategy to reduce this shortcomingby allowing the kernel size to be annealed over time. The annealing procedure comeswith the benefit that is may help cope with clusters of significantly different scales,by discovering large-scale data structures in the early stages of the algorithm, fol-lowed by a "fine-tuning" as the kernel size decreases. We show experimentally thatwe obtain clustering results which are comparable or better than the state-of-theart graph spectral methods.
Of course, clustering based on information theoretic ideas is not new. However,the coupling between graph-based clustering methods, Parzen windowing and in-formation theory which we present in this paper is new. Our novel algorithm is asubstantial improvement over a related algorithm proposed by Gockay and Principe[17], based on Renyi's entropy. Their clustering technique was based on calculatingthe cost function for all clustering possibilities, hence impractical for anything butvery small data sets. Other information theoretic methods include Watanabe [18],who used a coalescence model and a cohesion method to aggregate and shrink thedata into desired clusters. Rose et al. [19] employed the robustness properties ofmaximum entropy inference for vector quantization, and Hofmann and Buhmann[20] applied the same criterion for pairwise clustering. Roberts et al. [21] proposeda clustering method based on minimizing the partition entropy. Recently, Tishbyand Slonim [22] proposed the information bottleneck method.
The remainder of this paper is organized as follows. In section 2, the theory behindthe Information Cut is derived. In section, 3, a gradient descent-based optimizationstrategy is outlined. We present some clustering results in section 4. Finally, wemake our concluding remarks in section 5 2 .
The connection between information theory and graph theory was first mentioned in [23]. A previous version of the proposed clustering algorithm was introduced byJenssen et al. in [24].
The Information Cut The Cauchy-Schwarz divergence is given by [25] CS (p1, p2) = − log qR p2(x)dx R p2(x)dx This is a symmetric measure, such that 0 ≤ DCS < ∞, where the minimum isobtained if and only if p1(x) = p2(x). Since the logarithm is a monotonic function,we may just as well focus on the argument of this function. If the "distance" betweenthe densities is large, the argument of this function will be small. Let us estimatethis quantity by replacing the actual pdfs by their Parzen window estimators. Letxi, i = 1, . . , N1, be data points drawn from the density p1(x), and let xj, j =1, . . , N2, be data points drawn from p2(x). Then, the Parzen window estimatorsfor these distributions are [26] σ (x, xj ), where W is the Parzen window, or kernel. The Parzen window must integrate to one, and is typically chosen to be a zero mean pdf itself,such as the spherical Gaussian kernel. In that case, where xl is some data point in the data set. Notice that the assumption of GaussianParzen windows is not critical for the following derivation, as shown in AppendixA.
According to the convolution theorem for Gaussian functions, the following relationholds Wσ(x, xl)Wσ(x, xl0 )dx = W√ (x In the remainder of this paper, we denote W√ (x l, xl0 ) by kll0 . Thus, when we replace the actual densities in the argument of (3) by the Parzen window estimators,and utilize (6), we obtain σ (x, xi)Wσ (x, xj )dx Notice that this expression can be related to the graph-cut, by relating the datasamples to nodes in a graph. Hence, we relate the samples corresponding to p1(x)with a graph G1, and the samples corresponding to p2(x) with a graph G2.
Now we perform an exactly similar calculation for the two quantities in the de-nominator of (3), yielding R ˆ p2(x)dx = 1 PN1,N1 k ii0 and likewise R ˆ jj0 . Based on these expressions, we define the new graph partitioning cost function which we call the Information Cut (IC), as qPN1,N1 k PN2,N2 k In graph theory, a quantity known as the volume of a graph is given by the sumof all the edge-weights in the graph. Hence, V ol(G1) = PN1,N1 k ii0 and V ol(G2) = jj0 . Therefore, the Information Cut may also be written as pV ol(G1)V ol(G2) In order for the Information Cut to take a small value, there is a trade-off betweena small cut-value, and a large value for the product of the volumes. Hence, ourderivation has introduced a theoretically well-defined normalization which will pre-vent the Information Cut from obtaining a minimum when one node is isolatedfrom the rest. In the case of partitioning a graph into more than two subgraphs, i.e.
subgraphs Gc, c = 1, . . , C, we define the following multi-way cut where Cut(G1, . . , GC) is the sum of all the edge-weights that need to be removedin order to create C subgraphs.
Kernel Size Selection Based on Parzen Windowing In order to derive the Information Cut, we have explicitly used the Parzen windowtechnique for density estimation. In fact, the Parzen window defines the affinitymeasure kll0 between two graph nodes l and l0, given by (6). Parzen kernel sizeselection has been thoroughly studied in the statistics literature [27–29]. The optimalkernel size may be selected in order to minimize the asymptotic mean integrated squared error (AMISE) between ˆ p(x) and the target density p(x). A rough estimate of the AMISE optimal kernel size for d-dimensional data is given by Silverman'srule [27] where σ2 = d−1 P Σ are the diagonal elements of the sample covari- ance matrix. There are also other more advanced approaches to kernel size selection.
We use Silverman's rule in our algorithm as an initial value.
Clustering by Information Cut Minimization using the Methodof Lagrange Multipliers The cluster membership vectors mi, i = 1, . . , N , are defined as C dimensionalbinary vectors. Only the c'th element of any mi equals one, meaning that datapattern xi is assigned to cluster c (crisp cluster memberships). We rewrite (8) as afunction of the memberships, obtaining Our goal in clustering is to assign memberships such that IC(m1, . . , mN ) is min-imized, because this corresponds to the Cauchy-Schwarz divergence between thecorresponding Parzen window estimated pdfs being maximized.
We propose to solve this minimization problem by the method of Lagrange multi-pliers [30]. Hence, we need to fuzzyfy the membership vectors (each data point maybe assigned to several clusters at the same time), similarly to the fuzzy C-meansalgorithm [31].
Let mi ∈ [0, 1]d, i = 1, . . , N. Now we define the following constrained optimizationproblem: IC(m1, . . , mN ), j = 1, . . , N , where 1 is a C-dimensional vector whose elements are all one. Hence, a data pattern is allowed to have a certain degree ofmembership to any cluster, but the constraint ensures that the sum of the member-ships adds up to one.
Now, we make a change of variables, and derive a fixed-point, gradient-based, learn-ing rule for clustering. Let mic = v2ic, c = 1, . . , C. Consider IC(v1, . . , vN ), j = 1, . . , N . The constraints in (14) are equivalent to the constraints in (13). The optimization problem, (14), amounts to adapting thevectors vi, i = 1, . . , N , such that where Γ = diag(2 mi1, . . , 2 miC). Notice that if all of the diagonal elements 2 mic, c = 1, . . , C, are positive, ∂IC → 0 implies that ∂IC → 0. We force all the elements of the membership vectors mi, i = 1, . . , N, to always be positive, byadding a small positive constant  (e.g.  ∼ 0.05) to all the elements during eachmembership update. See Appendix B for the derivation of ∂IC .
The necessary conditions that the solution of (14) must obey, are commonly gener-ated by constructing the Lagrange function [30], given by where λj, j = 1, . . , N , are the Lagrange multipliers. The necessary conditions forthe extremum of L, which also corresponds to the solution of the original problem,(14), are given by for i = 1, . . , N and j = 1, . . , N . From (17) we derive the following fixed-pointadaption rule for the vector vi as follows i = 1, . . , N , and where v+ denotes the updated vector.
We solve for the Lagrange multipliers, λi, i = 1, . . , N , by evaluating the constraintsgiven by (18) as follows After convergence of the algorithm, or after a predetermined number of iterations,we designate the maximum value of the elements of each membership vector mi, i =1, . . , N , to one, and the rest to zero.
Notice that the gradient-based optimization technique we have derived does not needfor the affinity matrix to be pre-computed and stored in the computer memory.
We initialize the membership vectors randomly according to a uniform distribution.
Better initialization schemes may be derived, although in our experiments, this ran-dom initialization yields good results. One may also use the output of a differentclustering algorithm, such as C-means [32], as the initial cluster memberships. How-ever, this may initialize the algorithm in a local minima, and we have observed thatit does not always perform well.
Kernel Size Annealing We show experimentally that in our algorithm the convergence problem can to acertain degree be remedied, by allowing the size of the kernel to be annealed overan interval of values around the optimal value. The effect of using a "large" kernelsize in the Parzen estimator, is that the pdf estimate will be an over-smoothedversion of the actual pdf. Hence, the Information Cut using a "large" kernel islikely to be a smooth function of the memberships, as opposed to using a "small"kernel. The approach taken, is to let the algorithm iterate toward the minimumof the over-smoothed cost function, while continuously decreasing the kernel size,hence leading the algorithm toward the actual global minimum. As opposed to mostgraph-based clustering algorithms, the annealing procedure therefore has the effectthat the affinity measure will not be fixed, but will start out large, and decreasetowards a small value.
Reducing Complexity The computation of all the gradients ∂IC , i = 1, . . , N , is an O(N 2) procedure at each iteration. Thus, it is important to reduce the complexity of the algorithm. The expression for the gradient ∂IC is derived in Appendix B. Note that we can calculate all quantities of interest in (24), by determining (25), for ∀i. To reduce complexity,we estimate (25) by stochastically sampling the membership space, and utilize Mrandomly selected membership vectors, and corresponding data points, to compute− PM m mkim as an approximation to (25). Hence, the overall complexity of the algorithm is reduced to O(M N ) for each iteration. We will show that we obtainvery good clustering results, even for very small M , e.g. M = 0.2N .
Clustering Experiments In this section we report some clustering experiments using the proposed Informa-tion Cut clustering method. In all experiments, we determine the Information Cutscale parameter using (11), and the number of stochastically selected membershipvectors for gradient computation is determined by M = 0.2N .
We compare with the Normalized Cut algorithm [5], which is considered by manyauthors to be a state-of-the-art graph-based clustering method. In [5], the Normal-ized Cut scale parameter was recommended to be in the order of 10 − 20% of thetotal range of the Euclidean distances between the feature vectors. We use 15% inour experiments 3 .
We manually select the number of clusters to be discovered. This is of course ashortcoming compared to a fully automatic clustering procedure, but it is commonlythe case in most graph-based clustering algorithms.
We also normalize the variance in each feature vector dimension to one in all exper-iments (for both algorithms) to avoid problems in case the data scales are signifi-cantly different for each feature. We do this since both methods assume a sphericalaffinity measure.
Demonstrating the Annealing Property Figure 1 (a) shows a two-dimensional data set consisting of 550 data points. Weprovide the number of clusters, C = 4, as an input parameter to both algorithms.
The Parzen window size used in the Information Cut algorithm is determined tobe σ = 0.12 by (11). This means that the effective kernel size used to calculate affinities between data points (nodes) is equal to ˜ 2σ = 0.17 by (6). Figure 1 (b) shows a typical result obtained by the Information Cut algorithm. By visualinspection, it clearly makes sense, meaning that the cluster structure underlyingthe data set seems to have been discovered. Figure 1 (c) shows a typical resultobtained by the Normalized Cut algorithm. It is significantly different from the The Matlab code we use is downloaded from Jianbo Shi's web-page (a) Two-dimensional data set (b) Information Cut (c) Normalized Cut Fig. 1. Original data set shown in (a). Typical (70% of the trials) Information Cutclustering result shown in (b). Typical Normalized Cut clustering result shown in(c).
results obtained by the Information Cut algorithm, and seems to fail to discoverthe cluster structure. For this particular data set, the scale parameter used in theNormalized Cut algorithm is determined to be σNC = 0.18. This means that theedge-weights (affinities) between nodes are roughly the same for both methods.
Hence, the significantly different clustering results observed must be a consequenceof 1) different clustering cost functions, 2) different optimization techniques, or both.
In the experiment, we had the Information Cut algorithm iterate over 200 iterations.
Using a fixed kernel size σ = 0.12, the result shown in Fig. 1 (b) was obtained in 70%of the 50 clustering trials. In the remaining trials, the algorithm did not converge toa reasonable solution, but rather a solution like the one obtained by the NormalizedCut algorithm. This illustrates the problem of using gradient descent to optimizenon-convex cost functions, i.e. convergence to a local minimum. Figure 2 (a) shows aplot where we monitor the value of the Information Cut over the 200 iterations. Theplot shows that in many cases (70%) the algorithm converges quickly (oftentimes (b) Kernel annealed Fig. 2. (a) Using a fixed kernel size, the algorithm does not always converge to theglobal optimum. The algorithm does not produce satisfying results in 30% of thetrials in this case. (b) By annealing the kernel size, the algorithm converges in alltrials.
in less than 20 iterations) to a low value. These trials correspond to the clusteringresult shown in Fig. 1 (b). But sometimes, the algorithm converges to a high value.
Figure 2 (b) shows the value of the Information Cut over 50 clustering trials, wherethe algorithm operates in annealing mode. This means that the kernel size initiallyhas a relatively large value, which is decreased with each iteration. In this particularexperiment we anneal the kernel size linearly from a starting value given by σstart =2σ to a final value given by σstop = 0.5σ over 200 iterations. In this case, thealgorithm always converges to a low value for the Information Cut, correspondingto the clustering result shown in Fig. 1 (b). Hence, the global minimum is obtained inevery single trial. The drawback is of course that several free parameters now must Fig. 3. Clustering result (error percentage compared to the result shown in Fig. 1(b)) obtained by the Information Cut algorithm over a range of kernel sizes. The"optimal" kernel size, σ = 0.12 by (11), lies in the middle of the range correspondingto a low error percentage.
be chosen. Recall that the Information Cut algorithm in fixed kernel mode has nofree parameters for the user to choose (except the number of clusters). In annealingmode, the annealing scheme must be chosen. Hence, an upper limit for the kernelsize must be selected, a lower limit, and the decay rate. If these parameters are notchosen wisely, it may be that the algorithm does not always converge to the globalminimum. In general, though, we may expect that the probability of convergence toa local minimum is decreased by incorporating kernel annealing in the InformationCut algorithm.
Experimentally, we have observed that σstart = 2σ and σstop = 0.5σ, with a step size∆σ = (σstart − σstop)/200, seem to be a robust choice. In practice, the algorithmshould be executed a few times, and then the clustering result corresponding tothe lowest Information Cut value should be chosen. We also propose to stop thealgorithm when the change in the cost function from one iteration to the next isnegligible. For example, one may stop the algorithm when the change in the costfunction is less than one percent from one iteration to the next.
In the next experiment, we wish to illustrate the effect of the Parzen window sizeon the clustering results, still using the data set shown in Figure 1 (a). Recall thatby (11), σ = 0.12 for this data set. Figure 3 shows the error percentage usingthe Information Cut algorithm for a range of kernel sizes. Here, we have used theclustering result shown in Fig. 1 (b) as the "ground truth." The plot is created byrunning the algorithm three times for each kernel size, and then picking the bestof these trials based on the value of the Information Cut (operating in fixed kernelmode). For σ < 0.05, the error percentage is very high. In the range 0.11 < σ < 0.16the error percentage is very low, before it rises again. Note that the kernel sizedetermined by (11) is in the middle of this range. In the range σ > 0.25, theerror percentage is very high again. On average, the algorithm stops after about 25iterations.
(a) Normalized Cut (b) Information Cut Fig. 4. Clustering of data set with different cluster data scales.
Non-Linear Clusters with Different Data Scales The annealing procedure comes with a positive side-effect when it comes to copingwith clusters of significantly different data scales. In Fig. 4 (a), we show the resultobtained by the Normalized Cut algorithm on a data set consisting of three clustersof different data scales. The Normalized Cut algorithm uses a fixed kernel size todetermine node affinites, and the clustering result clearly suffers from this property.
In fact, the Normalized Cut algorithm did not obtain satisfying results, even whenmanually tuning the kernel size. The result obtained by the Information Cut algo-rithm in annealing mode is shown in Fig. 4 (b). The three clusters have all beenrevealed, even though they have significantly different scales, and are separated byhighly non-linear cluster boundaries.
Pendigits Data Set This data set was created for pen-based handwritten digit recognition, and is ex-tracted from the UCI repository [33]. The data set is 16-dimensional. All attributesare integers in the range [0, 100]. From the test data, we extract the data vectorscorresponding to the digits 0, 1 and 2. These classes consist of 363, 364 and 364data patterns, respectively. We specify C = 3 as an input parameter to the algo-rithm. The clustering results are compared to the known data labels (unknown tothe algorithm). The Normalized Cut algorithm obtaines 73.4% correct clusteringon this data set. The Information Cut kernel size is automatically determined tobe σ = 0.63. Operating in annealing mode, using M = 0.2N samples for stochasticapproximation, the Information Cut algorithm obtaines 84.4% correct clustering. Aclear improvement compared to the Normalized Cut method.
One this data set, we investigate more closely the effect of the stochastic samplingapproach. The following table shows the Information Cut result (best out of fivetrials) obtained for a range of M .
M 0.1N 0.2N 0.3N 0.4N 0.5N % 83.5 84.4 84.7 85.3 84.1 M 0.6N 0.7N 0.8N 0.9N 1N % 84.5 83.8 84.7 85.3 85.0 We conclude that the stochastic sampling approach is very effective in terms ofcomputational complexity, at virtually no cost in performance.
The wine data set, extracted from the UCI repository, is a well-known benchmarkdata set. It consists of 178 instances. Each instance has 13 attributes correspondingto chemical properties of three types of wine. The classes consist of 71, 59 and48 data points, respectively. The normalized cut algorithm performs very well onthis data set, obtaining 96.6% correct clustering. The Information Cut algorithmperforms consistently equally good or better, obtaining 97.2% correct clustering,operating in annealing mode, with M = 0.2N .
Baseball Player Image In the following, we perform three image segmentation experiments. The Normal-ized Cut algorithm was presented as an image segmentation method in [5]. We perform these experiments to show that the Information Cut algorithm may obtaincomparable results also using images.
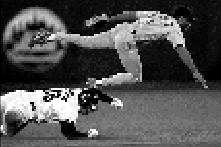
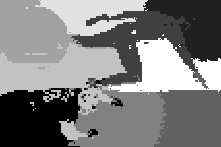
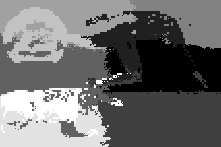
The (147 × 221) grayscale baseball player image is shown in Fig. 5 (a). It haspreviously been used to demonstrate the Normalized Cut algorithm in [5]. For eachpixel location, we generate three features. One feature is the pixel intensity, andthe other two features consist of the pixel location in the two-dimensional plane.
There are thus a total of 32487 feature vectors. This is a huge data set. On aPentium III 1GHz, 512 MBRAM computer, we did not have the capacity even tocreate the affinity matrix. In fact, in order to be able to execute the Normalized Cutalgorithm, we had to randomly select only 1/8 of the pixels to use in the clustering,the rest is classified relative to the clustered feature vectors according to a nearestneighbor rule. To make the algorithms comparable, we used the same subset forthe Information Cut algorithm. For the remaining image segmentation experiment,we also ranomly select a subset of the pixels for clustering, and classify the restaccordingly.
Figure 5 (b) show the result obtained by the Information Cut algorithm when par-titioning the image into nine segments. Figure 5 (c) show the result obtained by theNormalized Cut algorithm for nine segments. Both methods perform a reasonablesegmentation. Some differences are also observed.
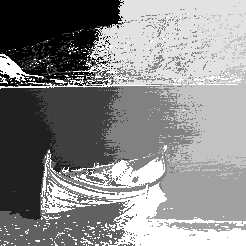
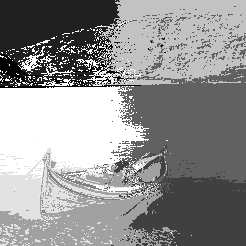
Northern-Norwegian Boat Image Figure 6 (a) shows the grayscale version of a (246 × 246) color image of an oldtraditional-style northern-norwegian boat. In this case, the feature vectors are five-dimensional, i.e. consisting of the rgb-values and the pixel coordinates. Figure 6(b) and (c) shows a segmentation into nine parts, using the Information Cut andNormalized Cut algorithm, respectively. The results obtained by the two methodsdiffer in this case. Especially when it comes to the ocean surface, it may seem asif the Information Cut algorithm is more sensitive to the inclusion of the pixelcoordinates in the feature vectors. The Normalized Cut algorithm produces somevery small clusters which are almost invisible in the segmentation.
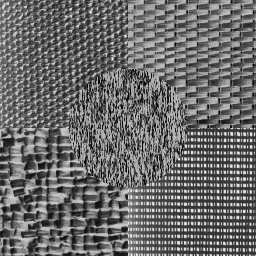
Texture Segmentation Figure 7 (a) shows a (256 × 256) textured image. It consists of five distinct regions,each with specific characteristics. We use the method proposed by Jain and Far-rokhnia [34] to produce feature vectors corresponding to pixel locations. Basically,the input image is filtered through a bank of 20 dyadic Gabor filters, producing a20-dimensional data set. The filtered images will have large energy in regions havinga texture characteristic "tuned" to a certain filter.
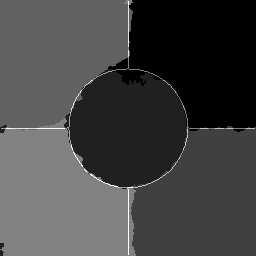
The result obtained by the Information Cut algorithm is shown in Fig. 7 (b). The


(a) Original (147 × 221) (b) Information Cut, 9 segments (c) Normalized Cut, 9 segments Fig. 5. Segmentation of the baseball player image.
five segments clearly correspond to the different textured regions in the input image,with some inaccuracies on the texture boundaries (texture boundaries indicated bythe white lines). The Information Cut misclassifies 3.0% of the pixels. The resultobtained by the Normalized Cut algorithm is shown in Fig. 7 (c). It also obtaines areasonable result, but not as good as the Information Cut. It misclassifies 5.1% ofthe pixels.
We have derived an interesting connection between a particular information the-oretic divergence measure, namely the Cauchy-Schwarz divergence, and the graphtheoretic cut. The key component in this derivation is the Parzen window techniquefor probability density estimation. The new graph theoretic cost function, namedthe Information Cut, provides a theoretically well-founded normalization to the tra-ditional cut-cost. This connection between information theory and graph theory can


(a) Original (246 × 246) (b) Information Cut, 9 segments (c) Normalized Cut, 9 segments Fig. 6. Segmentation of old traditional-style northern-norwegian boat image.
not be obtained for other divergence measures, such as the Kullback-Leibler, or theChernoff divergences.
A new algorithm for clustering and image segmentation based on minimizing theInformation Cut with respect to cluster membership variables has been derived. Ithas been shown that the resulting algorithm may perform comparable or better thanthe state-of-the art graph-based method, namely the Normalized Cut technique.
Moreover, we have argued that our optimization approach has benefits with respectto computational complexity and memory requirements. We have shown that ourstrategy for dealing with the problem of convergence to a local minimum, namelykernel annealing, may also have the positive side-effect that we are better able tohandle different cluster data scales.
Importantly, in this paper, two domains of research has been coupled, i.e. graph-based clustering and non-parametric density estimation in terms of Parzen win-dowing. Consequently, it was observed that the Parzen window width directly de-termines the affinity measure used to calculate edge-weights in the graph. It iswell-known that it is crucial for any graph-based method to determine this pa-


(a) Original (256 × 256) (b) Information Cut, 5 segments (c) Normalized Cut, 5 segments Fig. 7. Segmentation of a textured image consisting of five distinct regions.
rameter appropriately, but few data-driven methods exist. We used the simplestapproach for data-driven kernel size selection, namely Silverman's rule. However,more advanced techniques can easily be incorporated. Hence, we may study thestatistics literature in non-parametric density estimation, in order to gain new toolsfor computing edge-weights in the graph. In future work we will investigate whetherlocal and anisotropic Parzen windows used to calculate graph affinities may furtherimprove the clustering and image segmentation results. Another possibility is to usethe k nearest neighbors density estimation technique. We will also investigate theuse of the fast Gauss transform [35] to speed up the Parzen window density esti-mation, and hence speed up the clustering algorithm. Another issue which shouldbe studied is the annealing scheme. It may be possible to connect the annealingparameter to the local curvature of the cost function at each iteration step, thusmaking the annealing scheme user independent.
This work was partially supported by NSF grant ECS-0300340. Robert Jenssen ac-knowledges the University of Tromsø, for granting a research scholarship in order tovisit the University of Florida for the academic year 2002/2003 and for March/April2004. Deniz Erdogmus and Kenneth E. Hild II were with the Computational Neu-roEngineering Laboratory during this work.
Eq. (3) can be rewritten as where Ep{·} denotes the expectation operator with respect to the density p. Usingthe sample mean to estimate the expectations, we obtain E i, xj ), where W is some (non- Gaussian) Parzen window. In a similar manner, E j , xj0 ), such that we obtain qPN1,N1 k PN2,N2 k where we have defined W (xl, xl0) = kll0.
V ∂U − U ∂V where ∂vc0 = 0 . . 2 PN m . Thus, only element number c0 of this vector is nonzero.
ROBERT JENSSEN'S research interests are in non-parametric information the-oretic learning, kernel methods, spectral clustering and independent componentanalysis. Jenssen has received "Honorable Mention" for the 2003 Pattern Recog-nition Socitety Best Paper Award, and received the ICASSP 2005 OutstandingStudent Paper Award. He serves on the program committee of the IEEE MLSPconference.
DENIZ ERDOGMUS' research interests are in adaptive non-linear, and statis-tical signal processing. Erdogmus has received the International Neural NetworkSociety 2004 Young Investigator Award and the IEEE Signal Processing Society2003 Young Author Best Paper Award. He has served on the program committeeof numerous conferences.
KENNETH E. HILD II'S research interests are in independent component anal-ysis and other advanced signal and image processing techniques, with special ap-plication emphasis on magnetoencephalographic data. He serves on the programcommittee of the IEEE MLSP conference.
JOSE C. PRINCIPE'S research interests are in computational neuro-engineering,adaptive systems theory, machine learning and nonlinear dynamics. He is a Bell-South Professor, a fellow of the IEEE, Editor-in-Chief of the IEEE Trans. BiomedicalEngineering and the President of the INNS. He has rececived several awards, andhas served on numerous program committees.
TORBJØRN ELTOFT'S research interests are in remote sensing, image andsignal analysis and artificial neural networks . He received the year 2000 OutstandingPaper Award from the IEEE Neural Networks Society, and "Honorable Mention"for the 2003 Pattern Recognition Socitety Best Paper Award.
[1] R. O. Duda, P. E. Hart, and D. G. Stork. Pattern Classification and Scene Analysis. John Wiley & Sons, New York, 2nd edition, 2001.
[2] A. K. Jain and R. C. Dubes. Algorithms for Clustering Data. Prentice-Hall, Englewood Cliffs, 1988.
[3] S. Theodoridis and K. Koutroumbas. Pattern Recognition. Academic Press, San Diego, 1999.
[4] Z. Wu and R. Leahy.
An Optimal Graph Theoretic Approach to Data Clustering: Theory and Its Applications to Image Segmentation.
Transactions on Pattern Analysis and Machine Intelligence, 15(11):1101–1113,1993.
[5] J. Shi and J. Malik.
Normalized Cuts and Image Segmentation.
Transactions on Pattern Analysis and Machine Intelligence, 22(8):888–905,2000.
[6] C. H. Q. Ding, X. He, H. Zha, M. Gu, and H. D. Simon. A Min-max Cut Algorithm for Graph Partitioning and Data Clustering.
In Proceedings of IEEE International Conference on Data Mining, pages 107–114, San Jose, USA,November 29 - December 2, 2001.
[7] Y. Gdalyahu, D. Weinshall, and M. Werman. Self-Organization in Vision: Stochastic Clustering for Image Segmentation, Perceptual Grouping, and ImageDatabase Organization. IEEE Transactions on Pattern Analysis and MachineIntelligence, 23(10):1053–1074, 2001.
[8] J. Scanlon and N. Deo. Graph-Theoretic Algorithms for Image Segmentation.
In IEEE International Symposium on Circuits and Systems, pages VI141–144,Orlando, Florida, 1999.
[9] A. Y. Ng, M. Jordan, and Y. Weiss. On Spectral Clustering: Analysis and an Algorithm. In Advances in Neural Information Processing Systems, 14, pages849–856, MIT Press, Cambridge, 2002.
[10] Y. Weiss. Segmentation Using Eigenvectors: A Unifying View. In Proceedings of IEEE International Conference on Computer Vision, pages 975–982, Corfu,Greece, September 20-25, 1999.
[11] R. Kannan, S. Vempala, and A. Vetta. On Clusterings: Good, Bad and Spectral.
In Proceedings of IEEE Symposium on Foundations of Computer Science, pages367–377, Redondo Beach, USA, November 12-14, 2000.
[12] C. Alpert and S. Yao. Spectral Partitioning: The More Eigenvectors the Better.
In Proceedings of ACM/IEEE Design Automation Conference, San Francisco,USA, June 12-16, 1995.
[13] Y. Azar, A. Fiat, A. Karlin, F. McSherry, and J. Saia. Spectral Analysis of Data.
In Proceedings of ACM Symposium on Theory of Computing, pages 619–626,Heraklion, Greece, June 6-8, 2001.
[14] G. Scott and H. Longuet-Higgins.
Feature Grouping by Relocalisation of Eigenvectors of the Proximity Matrix. In Proceedings of British Machine VisionConference, pages 103–108, Oxford, UK, September 24-27, 1990.
[15] D. J. Higham and M. Kibble. A Unified View of Spectral Clustering. Technical Report 2, University of Strathclyde, Department of Mathematics, January 2004.
[16] R. Jenssen, T. Eltoft, and J. C. Principe. Information Theoretic Spectral In Proceedings of International Joint Conference on Neural Networks, pages 111–116, Budapest, Hungary, July 25-29, 2004.
[17] E. Gokcay and J. Principe.
Information Theoretic Clustering.
Transactions on Pattern Analysis and Machine Intelligence, 24(2):158–170,2002.
[18] S. Watanabe. Pattern Recognition: Human and Mechanical. John Wiley & sons, [19] K. Rose, E. Gurewitz, and G. C. Fox. Vector Quantization by Deterministic Annealing. IEEE Transactions on Information Theory, 38(4):1249–1257, 1992.
[20] T. Hofmann and J. M. Buhmann. Pairwise Data Clustering by Deterministic Annealing. IEEE Transactions on Pattern Analysis and Machine Intelligence,19(1):1–14, 1997.
[21] S. J. Roberts, R. Everson, and I. Rezek. Maximum Certainty Data Partitioning.
Pattern Recognition, 33:833–839, 2000.
[22] N. Tishby and N. Slonim. Data Clustering by Markovian Relaxation and the Information Bottleneck Method. In Advances in Neural Information ProcessingSystems, 13, pages 640–646, MIT Press, Cambridge, 2001.
[23] R. Jenssen, J. C. Principe, and T. Eltoft. Information Cut and Information Forces for Clustering.
In Proceedings of IEEE International Workshop on Neural Networks for Signal Processing, pages 459–468, Toulouse, France,September 17-19, 2003.
[24] R. Jenssen, D. Erdogmus, K. E. Hild, J. C. Principe, and T. Eltoft. Optimizing the cauchy-schwarz pdf distance for information theoretic, non-parametricclustering. In Proceedings of International Workshop on Energy MinimizationMethods in Computer Vision and Pattern Recognition, page (to appear), St.
Augustine, USA, November 9-11, 2005.
[25] J. Principe, D. Xu, and J. Fisher.
Information Theoretic Learning.
Unsupervised Adaptive Filtering, volume I, S. Haykin (Ed.), John Wiley & Sons,New York, 2000. Chapter 7.
[26] E. Parzen. On the Estimation of a Probability Density Function and the Mode.
The Annals of Mathematical Statistics, 32:1065–1076, 1962.
[27] B. W. Silverman.
Density Estimation for Statistics and Data Analysis.
Chapman and Hall, London, 1986.
[28] D. W. Scott. Multivariate Density Estimation. John Wiley & Sons, New York, [29] M. P. Wand and M. C. Jones. Kernel Smooting. Chapman and Hall, London, [30] S. S. Rao. Engineering Optimization; Theory and Practice. John Wiley & Sons, [31] J. C. Bezdek.
A Convergence Theorem for the Fuzzy Isodata Clustering Algorithms. IEEE Transactions on Pattern Analysis and Machine Learning,2(1):1–8, 1980.
[32] J. MacQueen. Some Methods for Classification and Analysis of Multivariate Observations. In Proceedings of Berkeley Symposium on Mathematical Statisticsand Probability, pages 281–297, University of California Press, Berkeley, 1967.
[33] R. Murphy and D. Ada.
UCI Repository of Machine Learning databases.
Technical report, Dept. Comput. Sci. Univ. California, Irvine, 1994.
[34] A. K. Jain and F. Farrokhnia. Unsupervised Texture Segmentation using Gabor Filters. Pattern Recognition, 24(12):1167–1186, 1991.
[35] A. Elgammal, R. Duraiswami, and L. Davis. The Fast Gauss Transform for Efficient Kernel Density Evaluation with Applications in Computer Vision.
IEEE Transactions on Pattern Analysis and Machine Intelligence, 25:1499–1504, 2003.

Source: http://www1.ece.neu.edu/~erdogmus/publications/J049_PATREC_NormalizedCutGradient_Robert.pdf

Art. 1.1475/ringraziamenti

European Review for Medical and Pharmacological Sciences 2015; 19: 149-153 Treatment with icatibant in the managementof drug induced angioedema G. BERTAZZONI, E. BRESCIANI1, L. CIPOLLONE1, E. FANTE1, R. GALANDRINI Research Center on Evaluation and Promotion of Quality in Medicine (CEQUAM), "Sapienza"University of Rome, Rome, ItalyEmergency Medicine Unit, "Sapienza" University of Rome, Umberto I Polyclinic, Rome, Italy

Oeguiahemofiliaargentina.indd

Guía para el manejo de la Hemofi lia Congénita Consenso de Médicos especialistas en Hemofi lia de la República Argentina FUNDACIÓN DE LA HEMOFILIA Buenos Aires - Argentina La impresión de esta Guía ha sido posible gracias a la colaboración de BAXTER S.A. 2da Edición. Buenos Aires, 1 de Julio de 2015. Agradecemos la colaboración de los médicos tratantes de personas con hemofilia